

For millennia, cultures have developed intricate methods to categorize time to assist agricultural activities. Babylonians developed a base-60 measurement of time, which is said to be the reason why we still have 60 minutes in an hour and 60 seconds in a minute. Ancient systems of measurement and observation were complex, and are still relevant.
Ancient Khemet, Maya, and countless civilizations developed cities that oriented towards celestial objects and their locations on the celestial sphere such as the rising of the sun during each equinox and solstice. The study of this facet of ancient societies is called archeoastronomy. In addition to cities, some sophisticated societies created calendars to translate these observations into a table representing units of time often for religious ceremony, but ultimately serving agricultural productivity. Religious monuments such as Stonehenge reveal the awareness of the nature’s cycles.

Today, planting guides and almanacs guide many gardeners and farmers tomove transplants from greenhouses out into the fields and sow their seed. Almanacs have been used for centuries to disseminate yearly weather predictions, calendars, and other information regarded as important. Almanac originates from the Arabic word المناخ (al-manak or al-manuk), which means calendar or climate.
Predictions update year to year, but rely often on specific dates in the Gregorian calendar and forecast modeling. Due to the changes in our climate and it’s seemingly unpredictable nature, farmers are finding themselves dealing with uncertainty, because the days of expected change are shifting in complex manner dependent on regional climate characteristics.

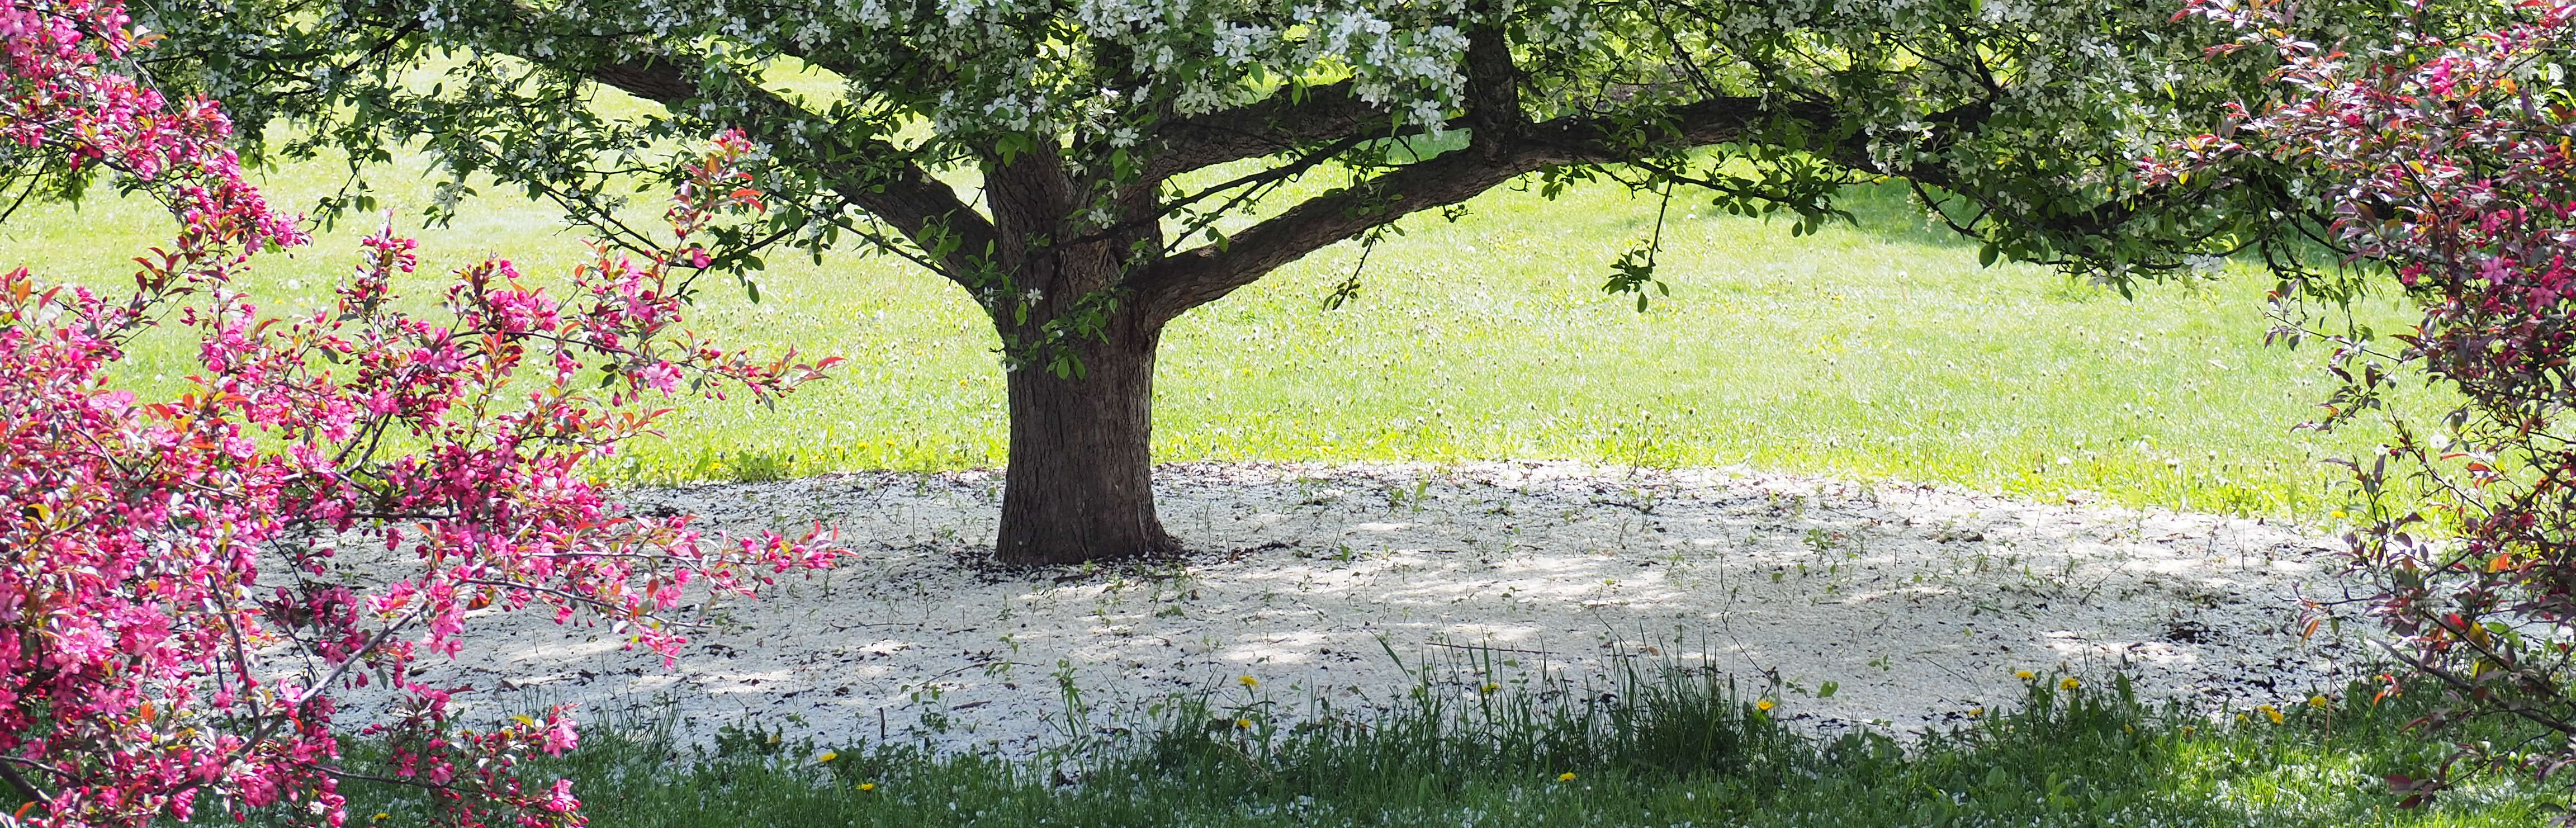
Warmer springs cause plants to grow during short periods of warmth and then get damaged by the return to the expected colder weather. These fluctuations can damage buds of trees and break the bark layer of young trees less resistant to drastic temperature swings. Since many plants in urban and horticultural environments are introduced from other regions in the world, climate change adds to the complex scenarios of weather related damages. Our desire to understand the cycles of nature increases during times of uncertainty.
Like our ancient predecessors, we look towards the sky. Except now we observe the Earth with greater scope. Can these observations be incorporated into the calendar framework?
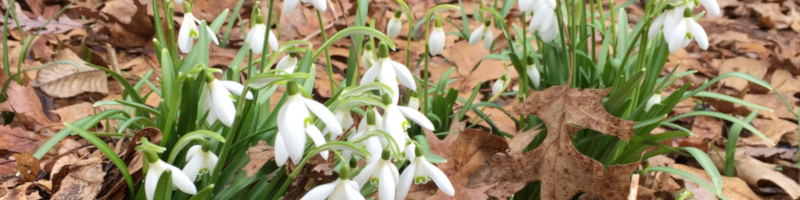
Phenology concerns itself with the study of the changes in nature. These changes can include, but are not limited to, the appearance of insects, the migrations of birds, the budding and flowering of plants. As seasons change species of fauna and flora react at different intervals. The appearance of a rare species, a change in frequency between species’ activities, and the order of these events can give us clues as to what longterm events are occurring. As climate changes, the changes to these recorded observations can be examined to help create forecasts.
One of the earliest records of this activity is Robert Marsham’s Indications of Spring, created in 1736 for his family estate in Norfolk, England. Modern examples include volunteer based observation networks as well as communications between university gardens.
By observing the budding of trees, the flowering of spring ephemerals and the activity of insects, horticulturalists are able to ascertain the rhythm of nature and react by planting their crops. To increase the rate of growth, the schedules of plantings incorporate the time a person can start their plants indoors before transplanting them into the field. If there is intense production, indoor growth requires a significant input of energy, which translates into high costs.
To enhance observations and assist planting, mathematical processing of daily temperature fluctuations can provide the accumulated degrees above a set threshold. This is commonly referred to as Growing Degree Days (GDD). GDD temperature thresholds are not a constant, but relative to an indication of relevant biological activity. As an example, 50F is often used as a base temperature for timing pesticide applications since this is the temperature associated with insect activity in the wild. Lower temperatures are used to represent zero plant growth. GDD provides a more accurate portrayal of the progression within a growing season, since it accounts for days where the temperatures are lower than average. As temperatures increase, albeit at inconsistent rates, the GDD value continues getting larger. In contrast, if the GDD value is abnormally low due to volcanic or other environmental events, it may give the impression that less time has passed.
As society advances, our capacity to tune into these changes is important for the wellbeing and health of the people. Observing them first hand is also a form of entertainment. Today with the use of complex communications networks, horticulturalists are able to compare their progressions in nature and determine trends that have before been unseen.
Read more
Swanson, Mark. The Babylonian Number System. University of Colorado Denver. http://math.ucdenver.edu/~jloats/Student%20pdfs/15_BabylonianNumbers.pdf
David, Gary A. The Orion Zone: Ancient Star Cities of the American Southwest. Graham Hancock. 17 February, 2016. https://grahamhancock.com/davidga1/
Crop and Climate Calendars: Growing Degree Days. Iowa State University. Department of Agronomy. http://agron-www.agron.iastate.edu/courses/Agron541/classes/541/lesson03a/3a.4.html
Biehl, Larry L. Multispec Exercise 10. Visualizing Growing Degree Day (GDD) Images. Purdue University. Department of Engineering. 15 August, 2014. https://engineering.purdue.edu/~biehl/MultiSpec/tutorials/MultiSpec_Exercise_10.pdf
Demarée, Gaston R, and Isabelle Chiune. A Concise History of the Phenological History at the Royal Meteorological Institute of Belgium. http://www.meteo.be/meteo/download/fr/3039998/pdf/rmi_scpub-1212.pdf (DOWNLOAD)
